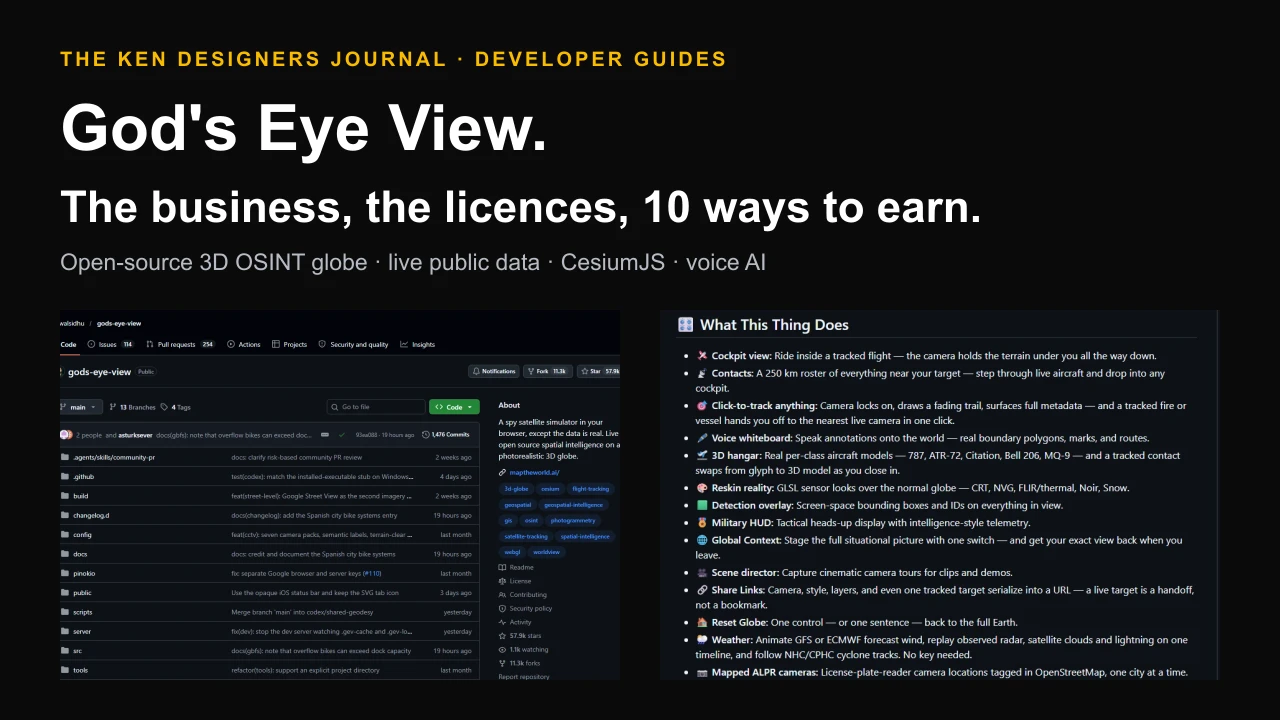
God's Eye View is an open-source app that puts live aircraft, ships, satellites, earthquakes, fires, weather and public cameras on a photorealistic 3D globe you can talk to. It launched in June 2026, reached number one on GitHub Trending in August and passed 57,000 stars by October. This guide explains how it works, what the code licence does and does not cover, how its creator turned a video series into a company, and ten detailed, realistic ways a developer or small studio could earn money with it. For each idea you get the buyer, the offer, the data licence path, a Kenyan example, a pricing model, the main risk and the first five steps. Nothing here promises income, and every idea respects the project's rule against tracking people.
What God's Eye View is
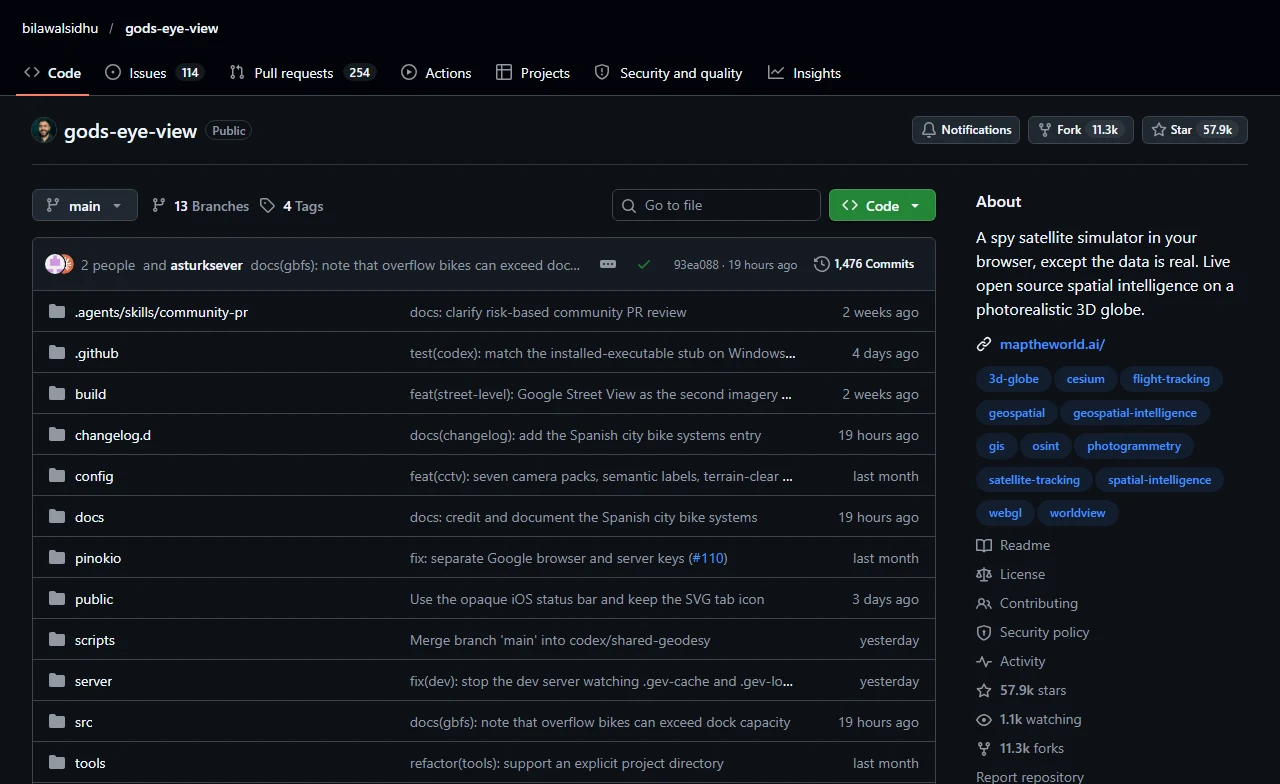
God's Eye View describes itself as a spy satellite simulator in your browser, except the data is real. It is a web application that fuses publicly broadcast signals onto one interactive 3D globe: aircraft transponders, ship beacons, satellite orbits, seismographs, fire detections, weather and public traffic cameras. You can follow a single flight down to the runway, switch the globe to a night-vision or thermal look, or ask out loud what a selected ship is.
The repository was created on 22 June 2026. When we checked on 18 October 2026 it had 57,862 stars, 11,280 forks, 75 contributors and roughly 1,476 commits, with releases from v0.1.0 on 31 August to v0.2.1 on 3 October 2026. The maintainers are Bilawal Sidhu and Sameh Khamis of Halfpixel, and the project was previously called WorldView.
It is popular because it looks like a classified operations room while being built entirely from open data and readable code. The README is direct about its limits. It calls the project an evolving client for exploration and learning, a fast, hackable foundation, not a hardened production service. It also warns that the data may be delayed, incomplete, modelled or wrong, and must not be used for navigation, emergency response, medical, investment or other safety-critical decisions.
Two things decide whether you can make money from it: the code, which you can use freely, and the data, which you often cannot. Most of this guide is about the gap between the two.
What it does
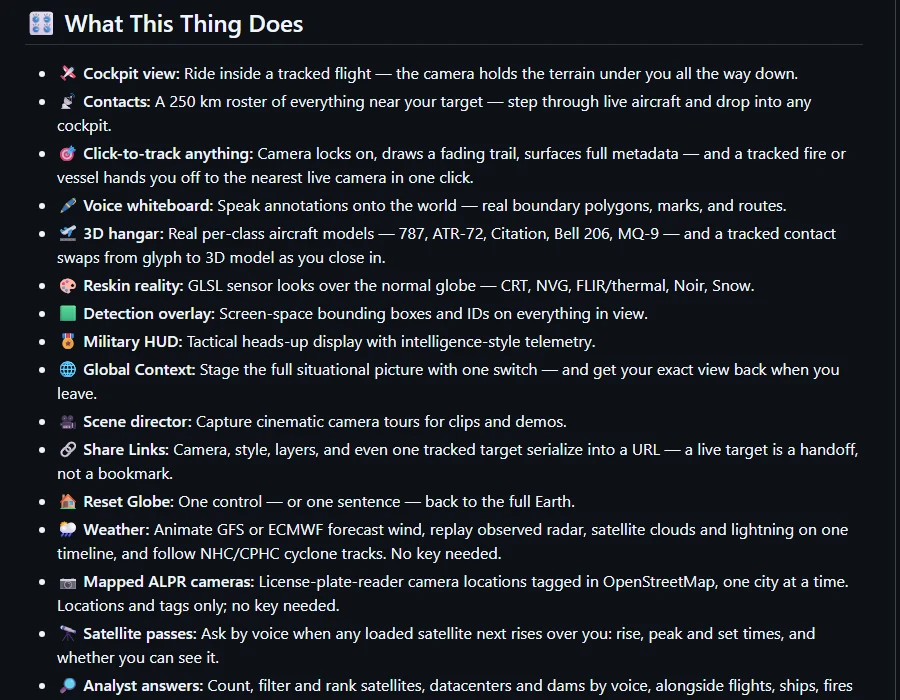
The README lists more than twenty capabilities. The ones that matter most for business use are:
- Click-to-track anything. The camera locks onto an aircraft, ship, satellite or fire, draws a fading trail and shows its metadata. A tracked fire or vessel can hand you to the nearest public camera.
- Contacts and cockpit view. A roster of everything within 250 km of a target, and a camera that rides inside a tracked flight all the way down.
- Voice control. With an OpenAI key, a realtime voice agent with around 30 tools understands what is on screen, answers questions about selected objects, draws routes and annotations, and counts or ranks things in view.
- Sensor styles and overlays. CRT, night vision, thermal, noir and snow looks, plus detection boxes and a military-style heads-up display.
- Scene director and share links. Record cinematic camera tours, and share a link that restores the camera, style, layers and even a tracked target.
- Weather without keys. Forecast wind from NOAA GFS or ECMWF, observed radar, satellite clouds, lightning and cyclone tracks on one timeline, with coverage that varies by region.
- Directions and measurement. Street-following drive, walk and cycle routes draped on the terrain, which the camera can then fly along, and distance measurement by voice.
How it works under the hood
The architecture is deliberately simple, which is good news if you want to extend it. There is no front-end framework: it is vanilla JavaScript, CesiumJS for the 3D globe and Vite for building. Photorealistic cities come from Google's 3D Tiles, and voice uses OpenAI's Realtime API.
Layers are modules. The source tree has a data folder with one module per layer, a layers folder for components such as weather, transit and camera views, a voice folder holding the realtime session and its tools, and a scenes folder for the cinematic director. Adding a new kind of data means writing a new layer module rather than changing the core.
Smooth motion from choppy data. Live feeds arrive every 15 to 30 seconds. The globe renders one interval behind real time and interpolates between known positions, with dead reckoning filling the gaps. Aircraft and ships keep their true heading at every camera angle. Satellites are propagated with the SGP4 model so their orbits stay locked in place.
Keys stay on the server. Every API call that uses a private key, such as OpenAI, AISStream, OpenSky or camera frames, goes through a server-side proxy with protection against request forgery, response size caps and cleaned-up errors. Only the Google Maps and Cesium ion keys reach the browser, and the project's security guide explains how to restrict them.
Local first. The server binds to localhost by default, so nobody else can reach it. Sharing on a network is an explicit opt-in, and the key settings panel is disabled when the server is shared. There are no user accounts, which matters for anyone hosting it for clients.
Budget controls. An OpenSky credit governor, a TomTom daily tile budget and disk-cached satellite data reduce repeated requests. OpenAI voice sessions on an API key show live spend, warn at $2 and stop at a $5 hard cap. These controls help, but they do not replace provider quotas or billing alerts.
# Node.js 24.x (24.14.0 or later) or 26.x
git clone https://github.com/bilawalsidhu/gods-eye-view.git
cd gods-eye-view
npm ci
npm run doctor      # checks Node, npm and which provider keys it can find
npm run dev         # then open http://localhost:4173

# Or, with Docker and no local Node install:
docker compose up
The data layers, and which ones you can use commercially
The README counts twenty layers and map sources, eighteen of which have a path that needs no key. The table summarises the main ones and the commercial position set out in the project's own DATA_SOURCES.md and LICENSE. It is a planning aid, not legal advice: terms change, so read the current provider terms before you charge anyone.
| Layer | Main source | Commercial use, in short |
|---|---|---|
| Live flights | OpenSky Network, with adsb.lol fallback | OpenSky is non-commercial and a live product may need a written agreement; adsb.lol is ODbL (attribution and share-alike) |
| Live vessels | AISStream.io (free key) | Free beta with no formal terms; a commercial product needs a paid AIS licence |
| Satellites | CelesTrak | U.S.-government-origin data, citation requested |
| Earthquakes | USGS | U.S. public domain |
| Active fires | NASA FIRMS (free key) | Public domain, citation requested |
| Wind and weather | NOAA GFS, ECMWF, NOAA nowCOAST | NOAA public data; ECMWF open data under CC BY 4.0 plus its terms |
| Basemap imagery | Esri World Imagery (keyless) | Usable in public-facing apps with attribution under Esri's terms |
| Photorealistic 3D | Google 3D Tiles via Cesium ion or a Google key | Cesium ion's free plan is non-commercial; Google direct is metered and may not be cached or stored |
| Public cameras | City and road-agency camera feeds | Each agency's terms apply; mostly North America and Europe |
| Street level | Mapillary, KartaView, Panoramax, Google Street View | Mostly CC BY-SA imagery; Google is billed per panorama |
| Submarine cables (bundled) | TeleGeography | CC BY-NC-SA 3.0: NOT for commercial use, remove the folder |
| Datacenters and dams (bundled) | OpenStreetMap extracts | ODbL: attribution and share-alike on the data |
| Bhote Koshi flood scene (bundled) | Vantor / GeoPera | CC BY-NC 4.0: NOT for commercial use without permission |
The licence trap: MIT code, non-MIT data
The project's LICENSE file grants the standard MIT permissions for the source code: use, copy, modify, merge, publish, distribute, sublicense and sell, as long as the copyright notice stays. Then it adds a note in capital letters: the MIT licence covers the source code only. Bundled datasets and everything fetched from providers at runtime belong to their sources and remain under their own terms. The 3D aircraft models are third-party works too, and the README says its demo GIFs are not licensed for standalone reuse.
For a business this produces a simple rule: you can sell your work on the code, but you must license the data separately. In practice, before any commercial deployment:
- Delete the TeleGeography submarine-cable folder, or buy a commercial licence from TeleGeography. The README says the rest of the app runs without it.
- Remove or license the Bhote Koshi flood scene, which is CC BY-NC 4.0.
- Do not run OpenSky in a commercial live product without your own agreement with OpenSky. adsb.lol under ODbL is an alternative with attribution and share-alike duties.
- Replace Cesium ion's free Community plan with a commercial plan ($149 a month for an individual when we checked) or a direct Google Maps key with billing, quotas and attribution.
- Budget for paid AIS data for any shipping product, because the free feed has no formal terms and limited coverage at sea.
- Keep every provider's attribution visible, and keep a written record of which layers each client deployment uses and under what terms.
# Before any commercial use: remove bundled data that is NonCommercial.
# The README says the app runs without this folder.
rm -rf src/data/local_data/telegeography_submarine_cables

# The Bhote Koshi flood scene (public/events/bhote-koshi-2026/ and
# src/data/bhoteKoshiFloodPath.js) is CC BY-NC 4.0. Read the event pack's
# README, then remove or license it before a commercial deployment.

# In .env, keep OpenSky anonymous or off unless you hold a commercial
# agreement, and use your own keys for every metered provider.
The business behind God's Eye View
The project is also a lesson in how open source can build a business, and it did not start with code. It started with an audience. Bilawal Sidhu's God's Eye View video series, made while the project was called WorldView, reported more than 5 million views on YouTube and more than 25 million across social platforms. Viewers kept asking for the code, a poll confirmed it, and the repository was released.
Distribution followed quickly: number one on GitHub Trending both daily and weekly in August 2026, number eight Product of the Day on Product Hunt, a one-click installer on Pinokio and a newsletter, Map the World. The maintainers' company, Halfpixel, describes itself as real-world spatial intelligence and is running a waitlist.
The README explains the plan. The original idea was to keep the repository as the open-source client and build a separate professional product. After launch, the most common request was simply for a link, so they are building an official hosted version. The repository stays open as the baseline.
It also names where the long-term value sits. In the README's words, the present is the cheap part: live feeds are mostly free. Going back in time, storing, tiling and replaying what happened and what changed at real resolution, is where data becomes expensive and compute becomes heavy. Historical data, premium imagery, satellite radar and commercial feeds are the paid layer of this market.
- Audience before product. The videos created demand, so the open-source release launched to people already waiting for it.
- Open source as marketing and recruitment. 75 contributors and 11,000 forks spread the project further than paid advertising could.
- Convenience is the first paid product. People who will never run a terminal still want the experience, so a hosted version is the natural first offer.
- History and premium data are the moat. Anyone can show the present; few can afford to store and serve the past.
The line you must not cross
The project is unusually clear about ethics. It models events, assets, infrastructure and systems, such as aircraft, vessels, satellites, fires, cameras and cities. It does not build features for searching for named people, recognising faces or tracking individuals, and it will not merge pull requests that cross that line. In the README's words, people are not a query type here.
Any business built on it should adopt the same rule in its contracts and marketing. Public data can still harm people when it is combined, for example a person's vehicle, their routine and a camera view. In Kenya, the Data Protection Act, 2019 governs personal data and is enforced by the Office of the Data Protection Commissioner, and the Computer Misuse and Cybercrimes Act, 2018 covers unauthorised access and related offences. If a client wants to follow a specific person, identify faces or watch someone's home, decline the work.
Two features need particular care. The mapped licence-plate-reader layer shows only camera locations tagged in OpenStreetMap, with no plate data or video, and should stay that way in anything you build. The public-camera layer shows feeds that agencies publish, mostly for traffic. Treat both as infrastructure context, never as a way to observe individuals.
How we chose the 10 money-making ideas
We started from what the repository is genuinely good at (fusing live public signals, tracking objects, cinematic capture, voice questions and easy extension) and asked who has a real problem it could solve. Each idea then had to pass four tests.
- A reachable buyer who already spends money on the problem, rather than a hoped-for mass market.
- A lawful data path: the client's own data, public-domain feeds, or a paid licence whose cost is known before pricing.
- Work you can actually deliver: setup, integration, support, training or production, not a promise of results.
- No harm to individuals: nothing that searches for, follows or identifies people.
The 10 ideas at a glance
Effort and risk ratings are editorial judgements to help you shortlist, not measurements. Start with the idea closest to your existing skills and clients.
| Idea | Best buyer | Startup effort | Data licence risk |
|---|---|---|---|
| 1. Company data on the globe | Fleets, utilities, distributors | Medium | Low: mostly the client's own data |
| 2. Managed private deployments | NGOs, newsrooms, universities | Low to medium | Low if clients hold their own keys |
| 3. Climate and disaster dashboards | Counties, NGOs, insurers, lenders | Medium | Low: public-domain feeds |
| 4. Fire and weather alerts | Farms, conservancies, lodges | Low | Low: NASA FIRMS |
| 5. Port and shipping visibility | Importers, clearing agents | High | High: needs paid AIS |
| 6. Cinematic map videos | Media, creators, brands | Low | Medium: imagery terms |
| 7. 3D property and tourism flyovers | Developers, lodges, agents | Medium | Medium: paid 3D imagery |
| 8. STEM and geography education | Schools, universities, camps | Low | Low with keyless layers |
| 9. Newsroom verification training | Newsrooms, fact-checkers | Low | Low; high ethical care |
| 10. Courses and geospatial freelancing | Developers, map-heavy companies | Low | Low |
Idea 1: Put a company's own data on the globe
Who pays. Transport and delivery firms, utilities, telecom and tower companies, distributors with many branches, security companies managing guard posts, and SACCOs or banks with field agents.
What you sell. A private map of the client's own assets, such as vehicles, depots, towers, shops or sensors, drawn as a custom layer beside public context like weather, fires and roads. Optionally add a voice question layer so managers can ask what is happening in a region.
How the repository helps. The README describes each layer as a separate module and invites developers to bring their own data. That modular layer system, the click-to-track behaviour, trails and share links are the reusable engine. You write the adapter that reads the client's GPS, database or spreadsheet.
Data and licence path. This is the cleanest idea legally, because the main data belongs to the client. Use only the public layers whose terms allow commercial use, such as NASA, NOAA and USGS public-domain feeds, and respect ODbL attribution and share-alike for OpenStreetMap-derived layers.
A Kenyan example. A hypothetical courier with 60 motorbikes across Nairobi and Kiambu wants dispatchers to see every rider, open delivery and rainfall on one screen, and to replay a disputed delivery route the next morning. This is an illustrative scenario, not a client.
Pricing model. Illustrative: a fixed discovery and prototype fee (for example KSh 80,000 to 150,000), a build fee for the first production layer (for example KSh 250,000 to 600,000 depending on integrations), then a monthly support and hosting retainer. These are planning examples, not market rates.
Main risk. Scope creep into a full fleet-management product. Keep the first release to one layer and one team, and say what it will not do.
First five steps:
- 1. Build a demo layer from a public dataset in the same shape as your target client's data, such as points with timestamps.
- 2. Interview three operations managers and write down the decisions they make from a map each day.
- 3. Agree the data feed (API, database export or GPS provider), refresh rate, who may see it and how long history is kept.
- 4. Deliver the layer behind a login (see the security section), with a short training session for dispatchers.
- 5. Offer a retainer covering updates, new layers and incident response, with clear hours and exclusions.
Idea 2: Managed private deployments and support retainers
Who pays. Organisations that like the tool but cannot run Node servers safely themselves: NGOs, research groups, small newsrooms, university departments and consultancies.
What you sell. Installation on a server you manage, a login in front of it, provider keys configured on the server, monitoring, backups, updates from the upstream repository, and a support channel.
How the repository helps. The repository ships Docker and a Docker Compose file, a setup doctor and detailed security notes, but it says it is not a hardened production service and has no user authentication. Making it safe and reliable for a team is real work that someone has to do.
Data and licence path. Each client should hold its own provider accounts and keys, so their usage, billing and terms are theirs. Remove NonCommercial bundled data unless the client's use is genuinely non-commercial, and document which layers are enabled and why.
A Kenyan example. A hypothetical Nairobi-based humanitarian NGO wants its coordinators to watch fires, weather and earthquakes across East Africa without anyone touching a terminal. This is an illustrative scenario, not a client.
Pricing model. Illustrative: a one-off setup fee plus a monthly retainer sized to response times and update frequency. Price support hours separately from infrastructure, which the client can pay directly.
Main risk. The maintainers have announced an official hosted version. Compete on local support, private data, custom layers and data-terms compliance, not on being a cheaper copy.
First five steps:
- 1. Deploy it on your own server first and write a runbook: install, update, roll back, rotate keys, restore from backup.
- 2. Put an authentication proxy in front of it and test that Provider Settings cannot be reached remotely.
- 3. Define two support tiers with response times and what counts as an emergency.
- 4. Track upstream releases (v0.1.0 to v0.2.1 shipped between 31 August and 3 October 2026) and test each before updating clients.
- 5. Write a one-page data-terms summary for each client so they know which layers they may use commercially.
Idea 3: Climate and disaster risk dashboards
Who pays. County disaster-management teams, humanitarian organisations, insurers and reinsurers, agricultural lenders, and companies with assets exposed to fire, flood or storms.
What you sell. A dashboard that combines active fires, forecast wind, observed weather and earthquakes with the client's exposure data, such as insured farms, warehouses or project sites, plus a weekly situation summary.
How the repository helps. The fire, wind, weather, cyclone and earthquake layers already exist and several are keyless. The analyst answers and voice tools help non-technical staff ask questions of the map. You add the exposure layer and the reporting.
Data and licence path. NASA FIRMS, USGS earthquake data and NOAA products are U.S. public domain or similar open terms, which suits commercial reuse with attribution. Some weather layers are regional, for example US radar and Americas lightning, so check what actually covers your client's area before selling it.
A Kenyan example. A hypothetical agricultural lender with farm loans across the Rift Valley wants to see which borrowers are near fires or extreme weather before approving restructuring requests. This is an illustrative scenario, not a client.
Pricing model. Illustrative: a setup project plus an annual licence or monthly subscription per organisation. Charge for the analysis and exposure integration, not for free public data.
Main risk. The README warns the data may be delayed, incomplete or wrong and must not be used for emergency response. Sell awareness and planning, never life-safety alerts.
First five steps:
- 1. Map which layers have real coverage over Kenya and East Africa today; FIRMS and earthquakes do, several weather layers do not.
- 2. Ask a target client for a sample exposure list and show it against last season's fires.
- 3. Agree what the client will do when an alert fires, so the dashboard supports a decision.
- 4. Add a weekly PDF or email summary for managers who will never open the globe.
- 5. Write the limits into the contract: delayed, modelled or missing data, and no use for emergency dispatch.
Idea 4: Fire and weather alert subscriptions
Who pays. Farms, ranches, conservancies, safari lodges, forestry operators and schools on large compounds.
What you sell. A simple subscription: tell us your boundary, and we message you when satellites detect fire within a set distance, with a link to the location on the globe.
How the repository helps. The globe becomes the place a subscriber clicks through to see the detection in context. The FIRMS layer and click-to-track behaviour do that already. The alerting runs as a small separate script, like the example below.
Data and licence path. NASA FIRMS provides data from MODIS and VIIRS satellites, with global data available about three hours after observation, and it already offers email alerts. Your value is the local setup, the messaging channel your clients actually read, the map context and the human follow-up.
A Kenyan example. A hypothetical conservancy in Laikipia wants a WhatsApp message when a fire is detected within 15 km of its boundary during the dry season. This is an illustrative scenario, not a client.
Pricing model. Illustrative: a small monthly fee per site, with an annual discount, or a per-season price. Keep it low enough that one prevented loss obviously justifies it.
Main risk. Overpromising. FIRMS already offers free email alerts, so the product must add local relevance, better delivery and support, not resell what is free.
First five steps:
- 1. Run the script below against a test area for two weeks and compare detections with what local contacts report.
- 2. Choose a messaging channel and get the client's written consent to receive alerts.
- 3. Handle duplicates: one fire produces several detections, so group nearby detections into one alert.
- 4. State clearly that satellite detection can miss fires and arrive hours late.
- 5. Sign up five pilot sites and collect feedback before charging more widely.
# fire_watch.py - email or WhatsApp a client when NASA FIRMS sees fire near them
# FIRMS area API: /api/area/csv/{MAP_KEY}/{SOURCE}/{west,south,east,north}/{days}
import csv, io, math, os, requests

MAP_KEY = os.environ["FIRMS_MAP_KEY"]        # free key from NASA FIRMS
SOURCE = "VIIRS_SNPP_NRT"
SITES = [  # client sites: name, latitude, longitude, alert radius in km
    ("Example conservancy HQ", -0.30, 36.90, 15),
]

def km(lat1, lon1, lat2, lon2):
    r = 6371
    p1, p2 = math.radians(lat1), math.radians(lat2)
    dp, dl = p2 - p1, math.radians(lon2 - lon1)
    a = math.sin(dp / 2) ** 2 + math.cos(p1) * math.cos(p2) * math.sin(dl / 2) ** 2
    return 2 * r * math.asin(math.sqrt(a))

def detections(west, south, east, north):
    url = (f"https://firms.modaps.eosdis.nasa.gov/api/area/csv/"
           f"{MAP_KEY}/{SOURCE}/{west},{south},{east},{north}/1")
    rows = csv.DictReader(io.StringIO(requests.get(url, timeout=60).text))
    return [(float(r["latitude"]), float(r["longitude"]), r) for r in rows]

for name, lat, lon, radius in SITES:
    pad = radius / 100 + 0.1            # rough box around the site, in degrees
    near = [(d, row) for la, lo, row in detections(lon - pad, lat - pad, lon + pad, lat + pad)
            if (d := km(lat, lon, la, lo)) <= radius]
    if near:
        closest = min(d for d, _ in near)
        print(f"ALERT {name}: {len(near)} detections, closest {closest:.1f} km")
        # send via your email, SMS or WhatsApp provider here
Idea 5: Port and shipping visibility
Who pays. Importers, clearing and forwarding agents, freight brokers and businesses whose stock arrives by sea.
What you sell. A view of vessels approaching and waiting at the port, tied to the client's own shipment list, with an estimated berthing picture and alerts when a named vessel arrives.
How the repository helps. The live vessels layer, click-to-track trails, the contacts roster and share links make a strong base. You add the shipment list layer and simple arrival rules.
Data and licence path. This is the hardest licence question in the list. The app uses AISStream, which the project describes as free and in beta with no formal terms of service. Terrestrial AIS also goes quiet offshore, and the README notes that satellite AIS costs real money. A commercial product needs a paid AIS provider whose licence covers your use.
A Kenyan example. A hypothetical Mombasa clearing agent wants clients to stop calling every morning to ask whether their ship has arrived. This is an illustrative scenario, not a client.
Pricing model. Illustrative: a monthly fee per client account, priced above the cost of the commercial AIS licence you need. Do the data-cost arithmetic before quoting anything.
Main risk. Data cost and licence. If the AIS licence costs more than clients will pay, stop and choose another idea.
First five steps:
- 1. Prototype with the free layer for internal research only.
- 2. Get quotes from commercial AIS providers for the coverage and refresh you need.
- 3. Build the shipment-list layer and a daily email summary.
- 4. Test with one agent and five of their clients for a month.
- 5. Only then decide pricing, once the data cost per client is known.
Idea 6: Cinematic map video production
Who pays. Media houses, YouTube and TikTok creators, documentary producers, brands telling a logistics or sustainability story, and event organisers.
What you sell. Short explainer videos and animated map sequences: a flight path, a storm, a launch replay, a route across a city, captured with the scene director and edited with narration.
How the repository helps. The scene director captures cinematic camera tours, share links reproduce a view exactly, and the sensor styles such as night vision and thermal make striking visuals. The project's own growth came from exactly this kind of video.
Data and licence path. Every frame must respect the terms of the imagery and data in it. Keep provider attribution visible, check Google Maps Platform and Esri terms for use in video, and use only imagery your plan covers commercially. The README says its own demo GIFs are not licensed for standalone reuse, so record your own footage.
A Kenyan example. A hypothetical Nairobi newsroom wants a 40-second animation tracing how a flood moved through a river valley for its evening bulletin. This is an illustrative scenario, not a client.
Pricing model. Illustrative: per video, with packages for monthly content. Price the research and editing time, not the capture.
Main risk. Licence and accuracy. A beautiful clip with an unlicensed basemap or a wrong claim damages a client's credibility.
First five steps:
- 1. Produce three sample clips on public-domain or properly licensed layers and put them on a reel.
- 2. Write a standard attribution and data-source note for every client video.
- 3. Approach two newsrooms and one creator with a specific story idea, not a generic offer.
- 4. Keep each project's sources and terms in a folder in case a claim is challenged.
- 5. Offer a monthly slot package once one client returns.
Idea 7: 3D flyover presentations for property and tourism
Who pays. Property developers, real estate agents, architects, safari lodges, hotels and tour operators.
What you sell. A guided 3D flyover of a site and its surroundings, with access roads, nearby amenities and travel routes drawn on the terrain, delivered as a video and a shareable interactive view.
How the repository helps. Directions draw street-following routes and fly the camera along them; the voice whiteboard and annotations mark boundaries and points of interest; the scene director records the tour.
Data and licence path. Photorealistic 3D city detail comes from Google 3D Tiles, either through Cesium ion or a direct, metered Google key. Cesium ion's free Community plan is for personal, non-commercial use, and its Commercial plan started at $149 a month when we checked. Coverage of photorealistic 3D varies by location, so confirm the client's area before promising it; the keyless Esri satellite basemap is the fallback.
A Kenyan example. A hypothetical developer selling plots near a new bypass wants buyers abroad to see the route from the airport to the site. This is an illustrative scenario, not a client.
Pricing model. Illustrative: per project, with a premium for an interactive version hosted for a set period.
Main risk. Imagery licensing and outdated imagery. Never present old aerial imagery as the current state of a site.
First five steps:
- 1. Check photorealistic 3D coverage for three target neighbourhoods.
- 2. Price a commercial imagery route into every quote.
- 3. Build one sample flyover on a public landmark to show the style.
- 4. Agree the claims you will show, such as travel times, and label them as estimates.
- 5. Package video, stills and an interactive link with a clear hosting end date.
Idea 8: STEM and geography education programmes
Who pays. Private schools, international schools, universities, coding bootcamps, science centres and holiday camps.
What you sell. Workshops and lesson packs where students explore satellites and orbits, earthquakes, weather and aviation on a live globe, then write a small layer of their own.
How the repository helps. Satellite passes, launch replays, earthquakes and weather are ready-made lessons in physics and geography, and the codebase is plain JavaScript, which suits teaching.
Data and licence path. Use keyless and public-domain layers in class. Cesium ion's free plan is personal and non-commercial, so a paid workshop business should not depend on it; the keyless Esri imagery works without keys. Teach attribution as part of the lesson.
A Kenyan example. A hypothetical Nairobi international school wants a four-week after-school club where students track the International Space Station and present findings. This is an illustrative scenario, not a client.
Pricing model. Illustrative: per student per term, or per school per workshop day, with lesson packs sold separately to teachers.
Main risk. Classroom connectivity and device performance. Test on the school's actual computers before selling a programme.
First five steps:
- 1. Write three 60-minute lessons with clear learning outcomes tied to the curriculum.
- 2. Test them with one group and refine based on what students actually managed.
- 3. Prepare an offline-tolerant setup, since school internet can be unreliable.
- 4. Include a session on responsible data use and privacy.
- 5. Offer a teacher training day so schools can repeat the lessons without you.
Idea 9: Verification and open-source research training for newsrooms
Who pays. Newsrooms, fact-checking organisations, journalism schools and research NGOs.
What you sell. Training and a desk setup that teaches staff to check claims about events using public signals: was there a fire, an earthquake, a diverted flight or unusual weather where and when a post says so.
How the repository helps. The globe puts many public signals on one timeline and map, with provenance and staleness shown, which is what verification work needs. It complements, not replaces, established verification methods.
Data and licence path. Teach the project's own line: it models events, assets and infrastructure, and does not build features for searching for named people, recognising faces or tracking individuals. Training should cover Kenya's Data Protection Act and avoiding harm to people who appear in public data.
A Kenyan example. A hypothetical fact-checking desk wants its team to confirm or debunk viral videos claiming fires or floods in specific towns. This is an illustrative scenario, not a client.
Pricing model. Illustrative: a per-day training fee for a group, plus an optional monthly desk-support retainer.
Main risk. Misuse and harm. Refuse work aimed at tracking or exposing individuals, and say so in your terms.
First five steps:
- 1. Build five realistic verification exercises from past public events.
- 2. Write a short ethics and safety module, including what not to publish.
- 3. Run a free pilot session for one newsroom in exchange for a testimonial.
- 4. Turn the exercises into a repeatable one-day course.
- 5. Offer follow-up support when the desk faces a hard verification case.
Idea 10: Developer courses, contributions and geospatial freelancing
Who pays. Developers who want geospatial skills, and companies hiring for map-heavy products.
What you sell. A course on building live 3D map applications with CesiumJS, using this codebase as the case study, plus freelance work that your public contributions make credible.
How the repository helps. The repository has 75 contributors and over 1,400 commits, a contributing guide and testing documentation. A merged layer or fix is public proof of skill that clients can inspect.
Data and licence path. Teach licences explicitly: MIT for the code, separate terms for every dataset, and a commercial route for imagery. Course materials should use your own recordings and properly licensed screenshots.
A Kenyan example. A hypothetical Kenyan developer adds a transit or bikeshare data pack for an African city, writes about it, and uses that to win a mapping contract. This is an illustrative scenario, not a client.
Pricing model. Illustrative: a self-paced course at a fixed price, a cohort version with live sessions at a higher price, and freelance work quoted per project.
Main risk. Building a course on a fast-moving codebase. Teach principles and keep version-specific details in an updatable appendix.
First five steps:
- 1. Pick a small, useful contribution, such as a data pack or documentation fix, and get it merged.
- 2. Write a clear tutorial about what you built and the licence checks you did.
- 3. Turn the tutorial into a short course outline and test demand with a waitlist.
- 4. Run a small paid cohort and improve the material.
- 5. Use the contribution and course as a portfolio when pitching geospatial projects.
What it costs to run
Most layers cost nothing, which is why the project can be explored for free. Costs appear when you share an instance, use photorealistic 3D commercially, turn on voice, or need data the free feeds do not cover. The figures below come from the README and provider pricing pages as checked on 18 October 2026. Treat them as planning numbers.
| Item | What it is for | Cost when we checked |
|---|---|---|
| Server | Hosting a private instance for a client | A 2 GiB VPS is about $12 a month; 4 GiB with 2 vCPUs about $24 (DigitalOcean list prices) |
| Google Photorealistic 3D Tiles | Detailed 3D cities, direct from Google | First 1,000 billable events a month free, then $6.00 per 1,000 (first tier) |
| Cesium ion | 3D tiles and terrain through Cesium | Community: free, personal and non-commercial only. Commercial: $149 a month (individual) |
| Google Street View | Street-level panoramas | First 5,000 events a month free, then $14.00 per 1,000 (first tier) |
| OpenAI voice | Talking to the globe | Metered per use; API-key sessions warn at $2 and stop at a $5 cap |
| TomTom traffic | Live congestion colours | Free tier of 200,000 tile requests a month, per the project's notes |
| NASA FIRMS, USGS, NOAA | Fires, earthquakes, weather | Free |
| Commercial AIS | Reliable ship positions for a paid product | Quoted by provider; get this before pricing a shipping product |
Deploying it safely for a client
The project's SECURITY.md is thorough, and it starts from a clear position: the app is local-first, binds to localhost and has no user accounts. Pinokio's network sharing is disabled for this launcher, and the README recommends a separately reviewed authentication proxy if remote access is required. For a client deployment, that means:
- Keep the app bound to 127.0.0.1 and put an authentication proxy in front of it, as in the example below.
- Put provider keys in the server's .env file, not in the in-app panel, which refuses proxied requests on purpose. Set GEV_ALLOWED_HOSTS to the hostname you serve.
- Restrict the browser-side Google Maps and Cesium ion keys to your domain at each provider, and set billing alerts and quotas.
- Give each client its own instance, keys and provider accounts, so one client's usage and data never mix with another's.
- Back up the folder that holds the .env file, caches and logs, and test a restore.
- Track upstream releases and test each one before updating a client, because the project moves quickly.
# Caddyfile - put a login in front of a shared instance (Caddy 2.8+)
# God's Eye View has no user accounts of its own; keep it bound to
# 127.0.0.1:4173 and let only the proxy reach it.
globe.example.co.ke {
    basic_auth {
        # create the hash with: caddy hash-password
        client-team $2a$14$REPLACE_WITH_A_BCRYPT_HASH
    }
    reverse_proxy 127.0.0.1:4173
}

# In the app's .env (Provider Settings refuses proxied requests on purpose):
#   GEV_ALLOWED_HOSTS=globe.example.co.ke
#   ...your provider keys...
What works in Kenya today, and what does not
Works well here: live flights and military traffic, satellites and launches, earthquakes, NASA fire detections, forecast wind, Esri satellite imagery, OpenStreetMap-based routing and mapping, and any private data layer you build. These cover most of the ideas above.
Thin or absent here: the public camera network is drawn from agencies in places such as Texas, California, London, Ontario, Finland and Estonia, not Kenya. Live transit feeds cover cities in North America and Europe. Observed rain radar is contiguous-US only, lightning density covers the Americas and Pacific, cyclone advisories cover the Atlantic and eastern and central North Pacific, and air quality is Canada only. Photorealistic 3D coverage varies, so check a location before promising it.
The opportunity in the gaps: every missing local layer is a possible project, such as a Kenyan transit data pack, county boundary and service layers, or a local weather station network. Add it with the data owner's permission and you have something no hosted product offers.
Practical realities: a 3D globe needs a reasonably capable computer and a stable connection, so test on the devices clients actually use. Bill in shillings with M-Pesa where clients expect it, and price any dollar-denominated provider costs with a margin for exchange-rate movement.
Common mistakes, and how to avoid them
Most failures with a project like this come from treating a viral demo as a finished product. The list below covers the ones we see most often in open-source commercial work.
- Assuming MIT covers everything. It covers the code only. Check every dataset, imagery source and 3D model.
- Exposing an instance to the internet without a login. The app has no accounts; put a reviewed authentication proxy in front of it.
- Selling life-safety alerts. The project explicitly rules out emergency response and navigation use. Sell awareness and planning.
- Reselling free data as if it were yours. Add local relevance, integration, support and analysis, or customers will find the free source.
- Ignoring the official hosted version. Compete on private data, custom layers, local support and compliance, not on a cheaper copy.
- Crossing the people line. Any feature that tracks or identifies individuals is out, and so is any client who wants one.
A practical 30-day plan
Days 1 to 5: run it locally, try every layer and read the README, DATA_SOURCES.md and SECURITY.md in full. Write down which layers have useful coverage where your clients are.
Days 6 to 10: choose one idea from the list that fits your skills and contacts. Write a one-page offer: buyer, problem, deliverable, data and licence path, exclusions and price range.
Days 11 to 18: build a demo for that buyer, using public-domain data or a realistic sample of their data. Deploy it behind a login on a small server and remove non-commercial bundled data.
Days 19 to 25: show it to five potential buyers. Ask what decision it would help them make and what they would pay to make it faster. Revise the offer.
Days 26 to 30: sign one paid pilot with a clear scope and end date, or decide the idea does not fit and try the next one. Use the downloadable checklist below to keep the licence, security and scope checks in one place.
Questions people ask
Is God's Eye View free to use commercially?
The source code is MIT-licensed, so you can use, modify and sell work built on it if you keep the copyright notice. The data is not covered by MIT. OpenSky flight data, the bundled TeleGeography submarine-cable map, the Bhote Koshi flood scene and Cesium ion's free plan are non-commercial, and other providers have their own terms. Remove or license those before charging anyone.
Who made God's Eye View?
It is maintained by Bilawal Sidhu and Sameh Khamis of Halfpixel. It grew out of Bilawal Sidhu's God's Eye View video series, previously called WorldView, and the repository bilawalsidhu/gods-eye-view was created in June 2026.
Do I need API keys to run it?
No. Most layers, including flights, satellites, earthquakes, public cameras and weather, work without keys on the Esri satellite basemap. Optional keys add photorealistic 3D (Cesium ion or Google Maps), voice (OpenAI), ships (AISStream), live fires (NASA FIRMS) and live traffic (TomTom).
Can I use God's Eye View to track a person?
No. The project does not build features for named-person search, face recognition or tracking individuals and will not merge them. In Kenya, personal data is also protected under the Data Protection Act, 2019. Build only for events, assets, infrastructure and systems.
Can I host God's Eye View for clients on the internet?
Yes, with care. It binds to localhost and has no user accounts, so put a reviewed authentication proxy in front of it, keep provider keys in the server's .env file, restrict browser keys at each provider and give each client a separate instance. The project describes itself as not a hardened production service.
Which idea is easiest for a Kenyan developer to start with?
Ideas built on your client's own data or on public-domain feeds carry the least licence risk: a private asset layer for a company, a managed deployment, a fire alert service using NASA FIRMS, or education workshops. Shipping and 3D property ideas depend on paid data, so check those costs first.
Put this guide to work
Download a practical template, fill in your requirements and bring it to your project conversation.
- God's Eye View business launch checklist ↓
Data licence checks, security steps, offer scoping, pricing questions and ethical limits for turning God's Eye View into a paid service.
Sources and research notes
Sources checked 18 October 2026. Recommendations and labelled scenarios are editorial guidance. Provider prices and capabilities can change; confirm them before purchasing.
- God's Eye View: upstream repository
Project purpose, features, architecture, layers, setup, keys and costs, responsible-use rules, business plans and repository metrics. Screenshots captured from this repository.
- God's Eye View: LICENSE
MIT licence for the source code and the note that third-party data, models and assets are not covered.
- God's Eye View: DATA_SOURCES.md
Per-source licences and commercial-use notes, including OpenSky, TeleGeography, AISStream, Google, Esri and OpenStreetMap.
- God's Eye View: SECURITY.md
Local-first security model, key handling and rules for sharing an instance.
- God's Eye View on Product Hunt
Product launch listing.
- Map the World newsletter
The newsletter behind the project, linked as the repository homepage.
- Halfpixel
The maintainers' company and its waitlist.
- Cesium ion pricing
Community plan restricted to personal, non-commercial use; Commercial plan price and 3D tile quotas.
- Google Maps Platform pricing
Photorealistic 3D Tiles and Street View free caps and prices per 1,000 events.
- NASA FIRMS
Active-fire data from MODIS and VIIRS, latency and email alerts; area API used in the alert example.
- AISStream.io
Free AIS feed used by the vessels layer.
- adsb.lol API
Flight data fallback under ODbL and its API terms.
- TomTom developer pricing
Traffic tile free tier referenced in the project's data notes.
- DigitalOcean: Droplet pricing
VPS prices used in the running-cost table.
- Office of the Data Protection Commissioner, Kenya
Regulator for the Data Protection Act, 2019, relevant to any layer involving personal data.

About this guide
AI-assisted research and original buyer checklists from the studio. Official documentation is linked above; examples are illustrative and do not describe verified client outcomes.
Ask Ken on WhatsApp